How To Build Predictable Census Growth for Behavioral Health Facilities
A practical framework for census growth in behavioral health: five stages, the metrics to track, and how to tie marketing spend to admits you can forecast.
Key Takeaways
- In 2024, 52.6 million people in the U.S. needed substance use treatment, and about 19.4% (10.2 million received treatment). For most facilities, an unstable census starts inside the facility, not with a lack of people who need care.
- Census usually swings for three reasons: most leads coming from one channel, raising spend only after census drops, and marketing and admissions data that don’t connect.
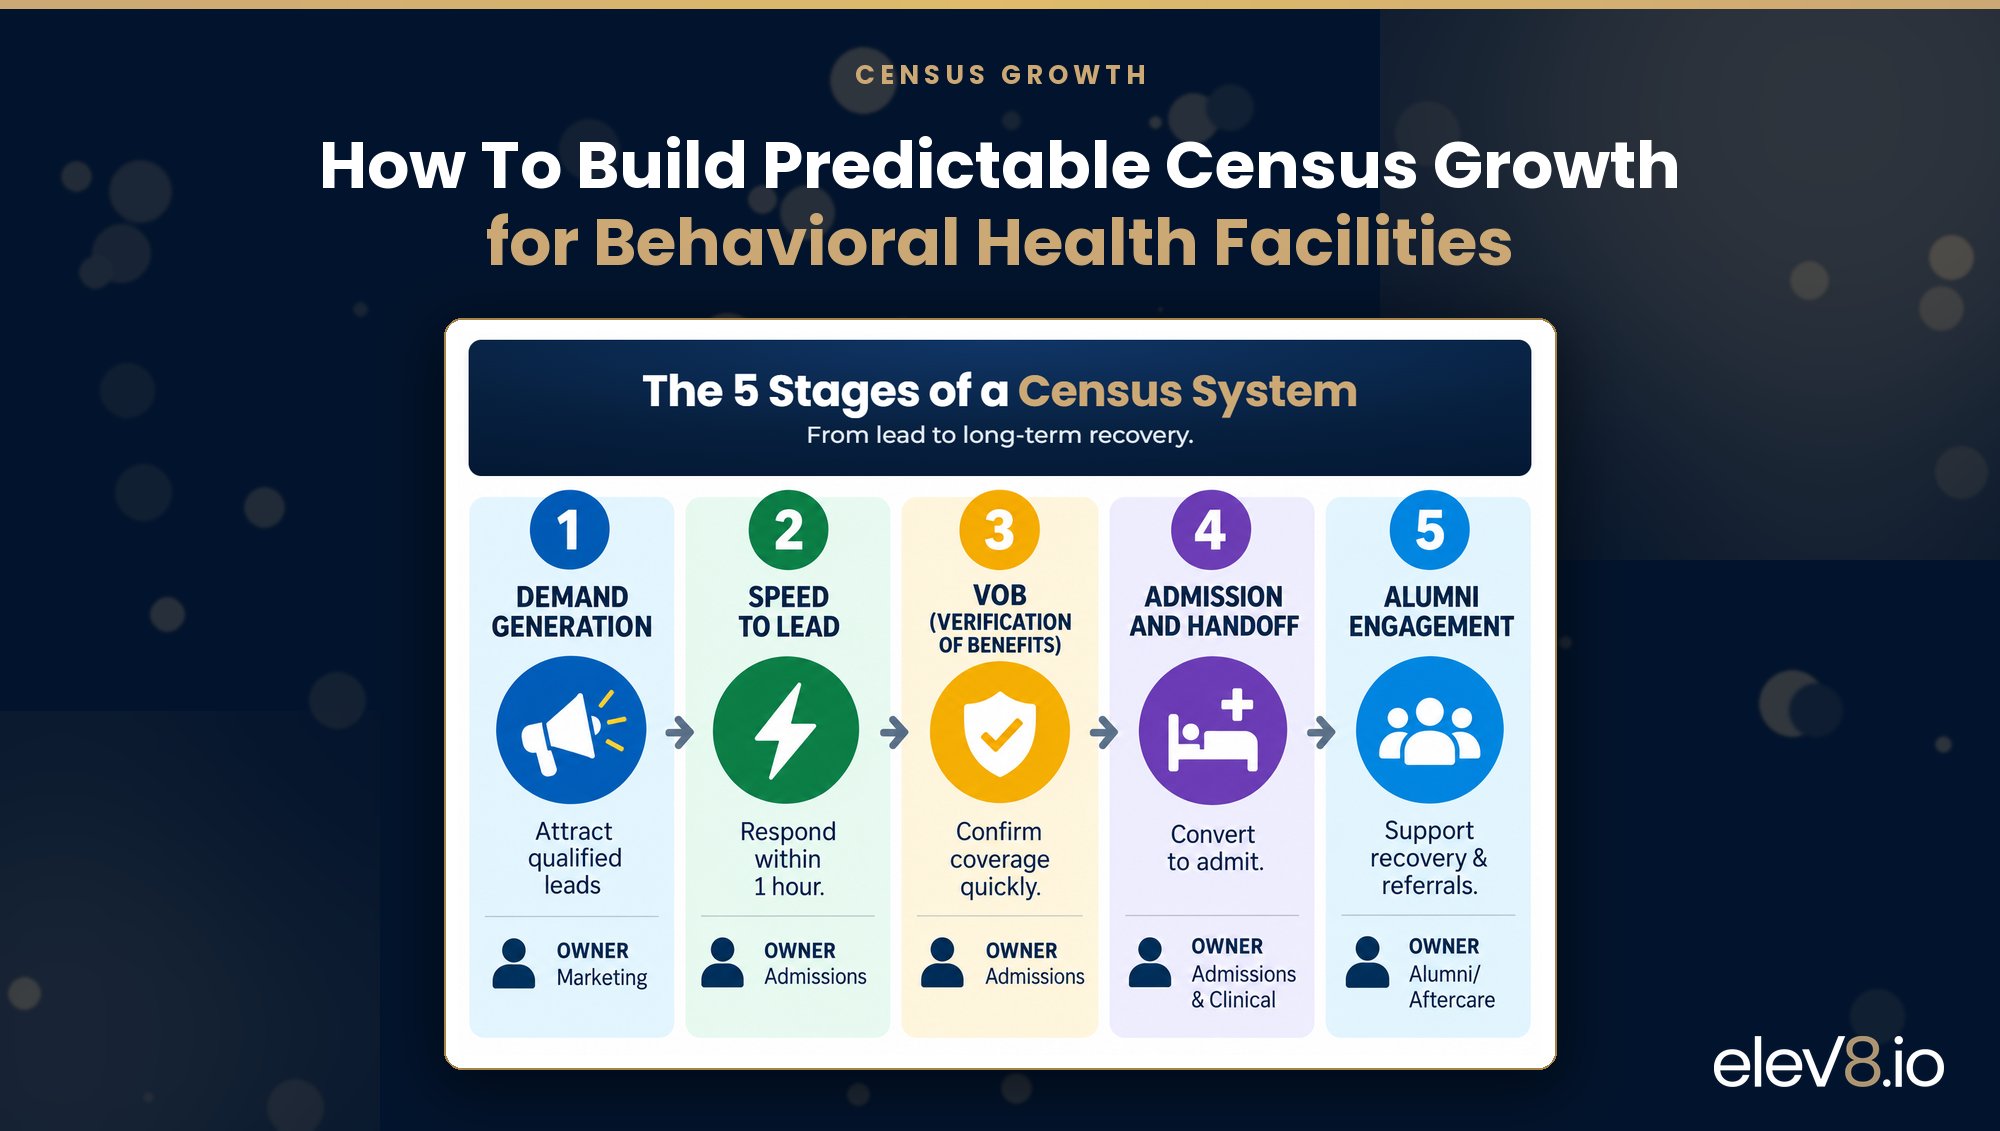
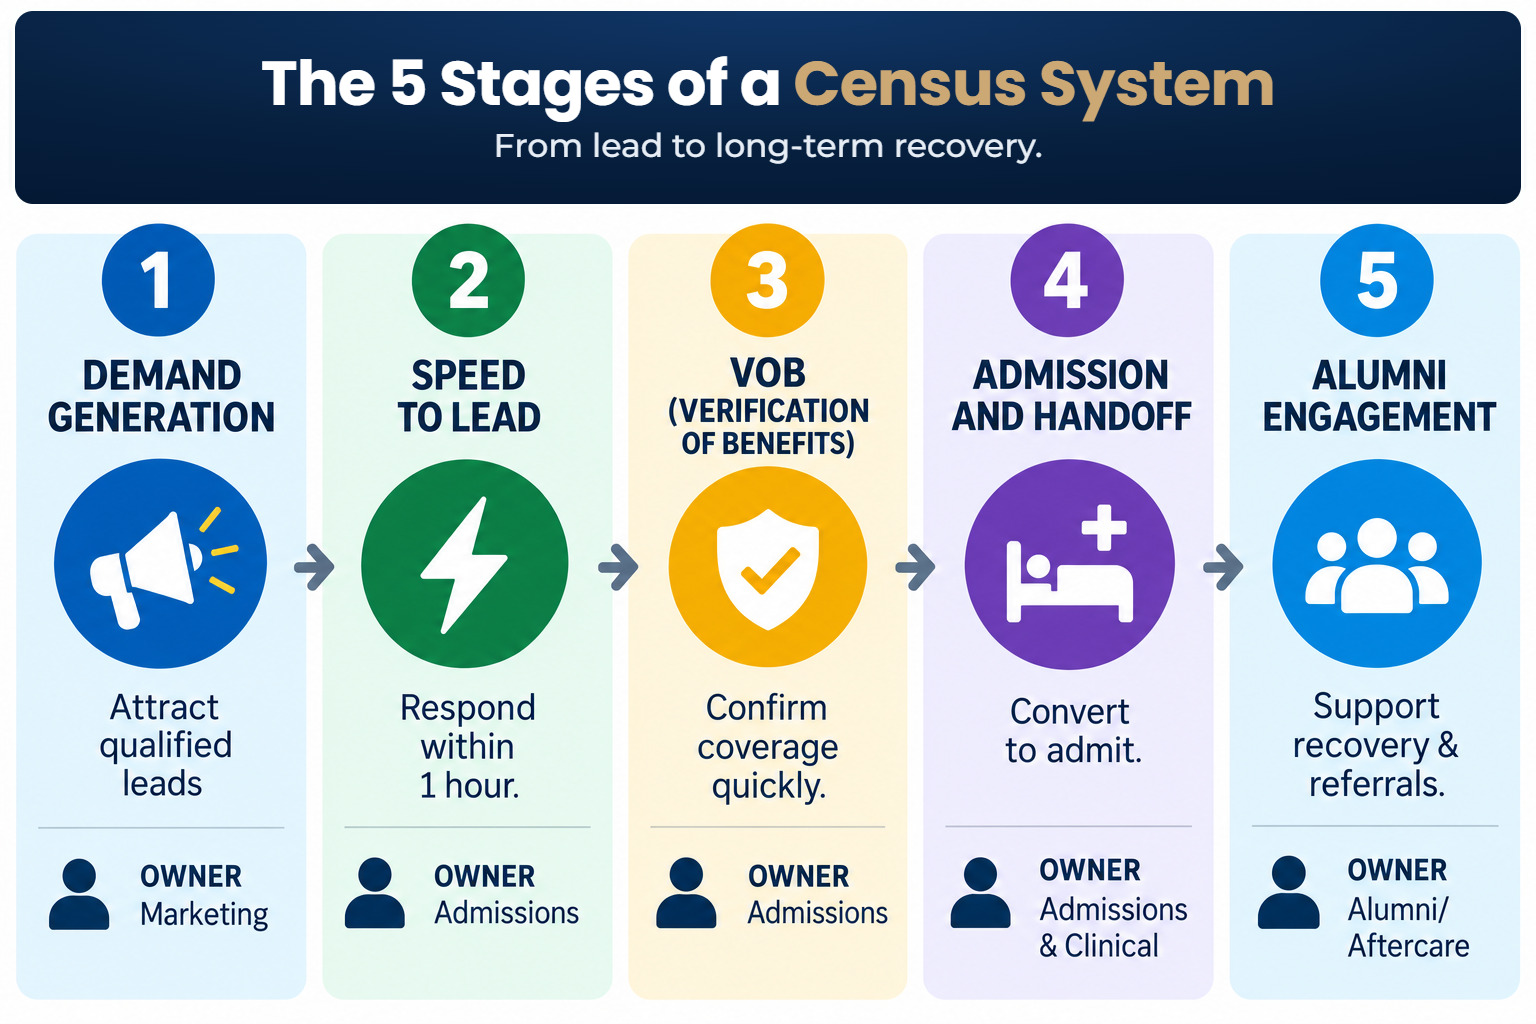
- A census system has five stages: demand generation, speed to lead, VOB, admission and handoff, and alumni engagement. Each needs an owner and a metric.
- Firms that contacted leads within an hour were nearly seven times as likely to qualify them.
- Working backward from a census target through length of stay, conversion rates, and CPL sets the lead volume and budget you need.
- A weekly review of the full funnel turns the census from a monthly surprise into a number you plan.
Census fluctuations are familiar to most treatment center operators. Admissions may improve for several weeks before dropping again, prompting leadership to increase advertising spend.
By the time those additional inquiries begin converting, census may already be recovering. What looks like inconsistent market demand sometimes stems from how the facility generates leads, manages inquiries, and moves prospective patients through admissions.
The need for care is large. National treatment data suggests that a shortage of people needing care is unlikely to explain every census problem. Of the 52.6 million people who needed substance use treatment that year, about 10.2 million received it 1. About 61.5 million adults experienced any mental illness 1.
Empty beds do not necessarily indicate weak demand. In many facilities, the more immediate problem is converting existing demand into admissions through effective outreach, timely responses, insurance verification, and follow-up.
This article lays out census growth for behavioral health operators as a system with five connected stages. It covers where census leaks, which metrics to track, and how to turn marketing spend into admits you can forecast.
Why Census Swings When Demand Holds Steady
Three patterns show up repeatedly in facilities with unstable census.
1. Single-Channel Dependence
Many facilities get most of their leads from one source. It may be one paid search campaign, one referral partner, or one page that ranks well. When that source shifts, census follows. A Google algorithm update, a paused campaign, or a referral contact who changes jobs can cut lead volume overnight.
2. Reactive Spend
When census drops, the common response is to raise the budget. New spend takes time to produce leads, and those leads take time to admit. By the time the admits arrive, census has often recovered on its own, and the extra spend looks wasted. The facility then cuts back, and the next dip hits harder.
3. Disconnected Data
Marketing may be reporting lead volume while admissions focuses on admits and finance tracks revenue. Without a shared view of the funnel, leadership struggles to identify where prospective patients are being lost. Each one needs a different fix.
The Five Stages of a Census System
Forecasting census becomes easier when operators can follow an inquiry from its original source through insurance verification and admission. That requires clear responsibility for each handoff and consistent measurement of how many prospective patients move to the next stage.
1. Demand Generation
Depending too heavily on one acquisition channel leaves census exposed to changes outside the facility’s control. A more resilient approach combines paid search, organic visibility, AI search discovery, and referral development.
Operators should monitor how much qualified lead volume comes from each source and establish a concentration threshold that triggers investment in alternative channels.
Paid search captures people searching for care today. SEO and AI search visibility build demand; you do not pay per click. Referral development brings in leads that often arrive with clinical context and a warm handoff.
2. Speed to Lead
Admissions response time is one of the few parts of the acquisition process a facility can directly control. A study of 2,241 U.S. companies published in Harvard Business Review found that only 37% responded to online leads within an hour 2. Firms that made contact within an hour were nearly seven times as likely to qualify the lead as firms that waited longer 2.
That research covers general sales, not treatment. The logic may hold even more strongly in behavioral health. A person or family seeking care often contacts several facilities at once. The first coordinator who answers with clarity and warmth is often the one who moves them forward. Track speed to lead for calls, forms, and chats, and staff intake to cover the hours when your leads arrive.
3. Verification of Benefits
Even a qualified inquiry can lose momentum during insurance verification, particularly when the process takes longer than expected or the coordinator cannot clearly explain the patient’s likely financial responsibility. Set a target turnaround time for VOBs, and train coordinators to explain benefits in plain terms without promising coverage the payer has not confirmed.
4. Admission and Handoff
A scheduled admission should not be counted as a completed admission. Transportation problems, changes in patient readiness, and gaps in communication can all prevent someone from arriving, even after the initial decision to enter treatment. Confirm travel, keep in contact with the patient and family before arrival, and assign one person to own each pending admit. Track no-shows by source and by coordinator so you can see where the handoff breaks.
5. Alumni and Retention
Alumni engagement can support long-term referral relationships and help former patients stay connected to appropriate resources. Its contribution to future admissions is less direct than paid search or referral development, but it can still be measured through consent-based alumni referrals and re-engagement.
Alumni engagement can keep former patients connected to support and to the facility. Engaged alumni and their families may also refer others. Treat alumni programs as part of the acquisition system, with clear consent practices and no claims about outcomes.
The Metrics That Make Census Forecastable
A useful census forecast starts with the conversion rates between qualified inquiries, verified benefits, and actual admissions. Track these at a minimum by channel and by week:
- Qualified lead volume
- Cost per lead (CPL)
- Speed to lead, measured in minutes
- Lead-to-VOB rate
- VOB-to-admit rate
- No-show rate for scheduled admits
- Cost per admit (CPA)
- Average length of stay
- Census by level of care and payer
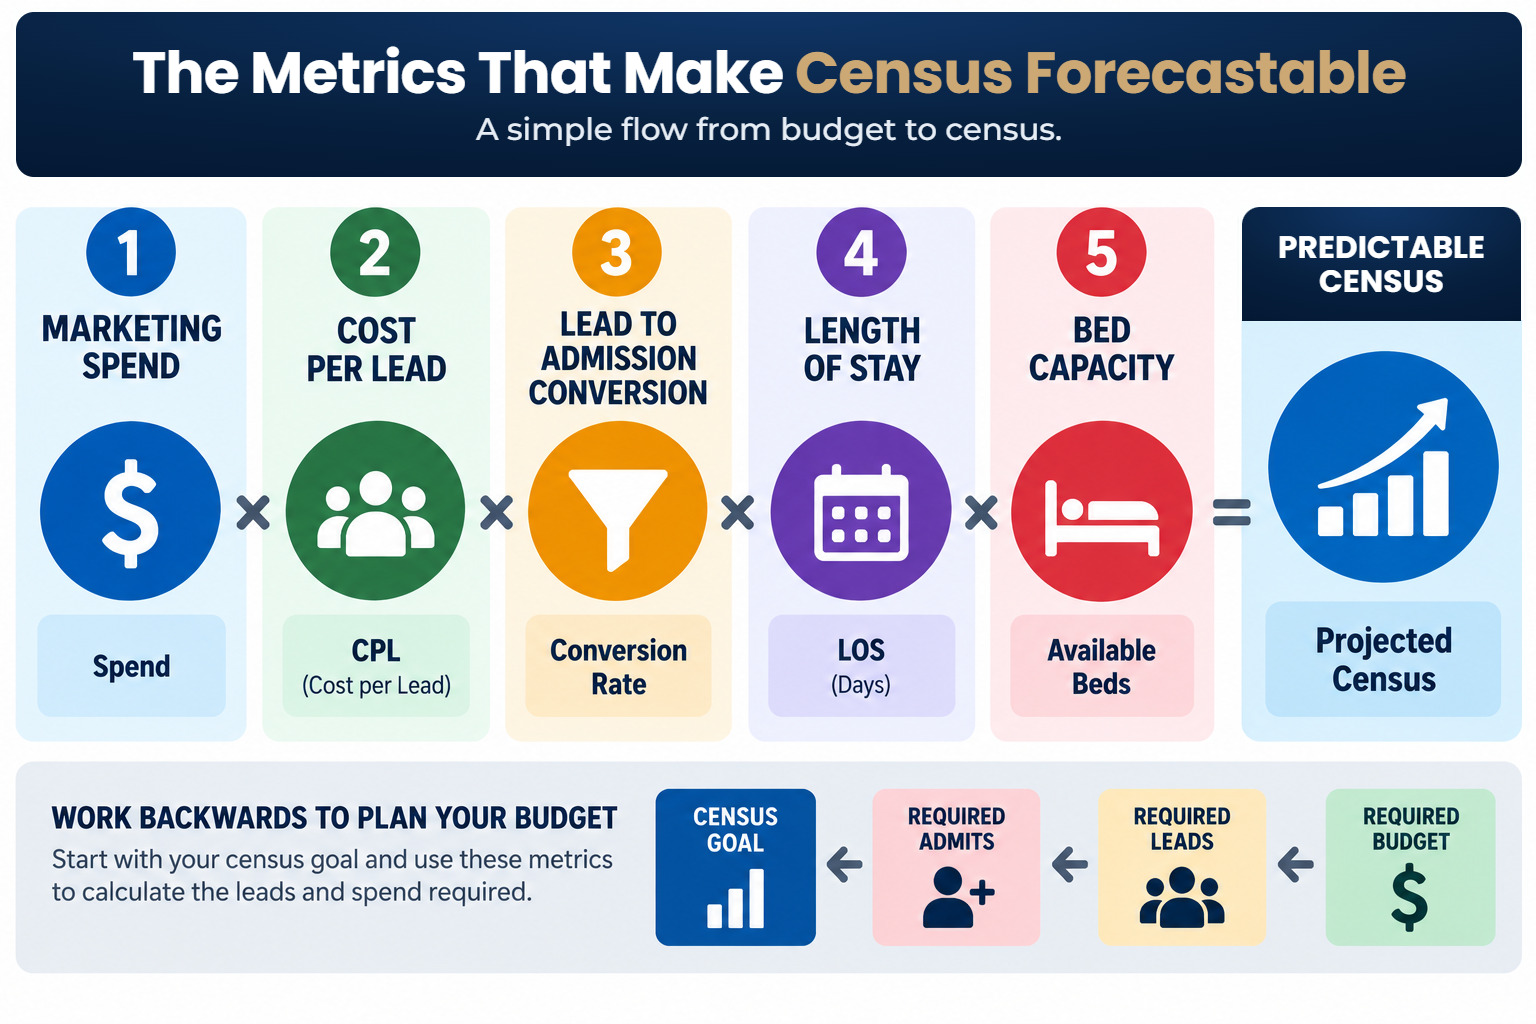
With these in place, you can work backward from a census target. Start with the census you need. Divide the patient days that target requires by your average length of stay to find the number of admits you need.
- Divide admits by your VOB-to-admit rate to find the VOBs you need.
- Divide VOBs by your lead-to-VOB rate to find the qualified leads you need.
- Multiply leads by CPL to set the budget.
- When any rate moves, the model shows which stage to fix and what it will cost to hold the census.
Try Our Free ROI & Census Growth Calculator
See how your marketing, admissions performance, and current census compare with relevant behavioral health benchmarks.
Tie Every Dollar to an Admit
Forecasting becomes more useful when the facility can connect admissions to the marketing activities that generated the original inquiry. Call tracking, form submissions, and CRM records should provide a consistent view of that journey, allowing budget decisions to reflect actual admissions performance.
Tracking in behavioral health must also account for patient privacy rules, so review your setup with your compliance team.
This approach can work for facilities at any stage. For Rushton Recovery, a new facility, elev8 reports an 885% increase in new users, 13,696 organic sessions, and a cost per admit of $1,500 3. Rushton’s founder and CEO credits the work with helping the facility reach full census 3. Results vary by market, payer mix, level of care, and admissions performance.
The Census: The elev8 Newsletter
Join 2,000+ behavioral health leaders. Get notified when we publish new articles — the strategies, data, and insights shaping behavioral health marketing.
2,000+ executives already subscribed
Unsubscribe anytime. Just one newsletter a month — no spam.
Build the Operating Rhythm
A weekly census review gives marketing, admissions, and leadership an opportunity to examine the same numbers and agree on where intervention is needed. The discussion should cover qualified lead volume, response times, VOB conversion, scheduled admissions, and actual arrivals.
If inquiries are increasing but admissions are flat, the team should investigate what is happening after first contact before increasing advertising spend. A drop in VOB conversion calls for a different response than a decline in lead volume. Assigning responsibility for each issue makes the following week’s review more useful and reduces the tendency to react to census changes with immediate budget adjustments.
Adjust channel mix before a single channel gets too large. Review lost leads as closely as admits, since the reasons people did not admit often point to the next fix. Over time, this rhythm turns census from a monthly surprise into a number you plan.
Conclusion
Predictable census growth requires more than a steady flow of inquiries. Facilities also need to understand how those inquiries move through admissions, where prospective patients drop out, and which channels consistently produce appropriate admissions.
For many operators, the most useful starting point is an audit of the existing process. How quickly are calls answered? How many qualified inquiries reach VOB? What percentage of verified patients actually admit? And can the facility trace those admissions back to the original source?
Answering those questions regularly gives leadership a better basis for decisions about marketing spend, admissions staffing, and growth targets. It also makes it easier to distinguish a genuine demand problem from an internal conversion problem.
The objective is not to eliminate every census fluctuation. It is to understand what is driving those changes early enough to respond with the right action.
Sources
- Substance Abuse and Mental Health Services Administration. (2025). Key substance use and mental health indicators in the United States: Results from the 2024 National Survey on Drug Use and Health. Center for Behavioral Health Statistics and Quality.
- Oldroyd, J. B., McElheran, K., & Elkington, D. (2011, March). The short life of online sales leads. Harvard Business Review.
- elev8. (n.d.). Rushton Recovery Case Study. elev8.io

Founder & CEO · elev8.io
Gary Garth is the Founder & CEO of elev8.io, where he helps behavioral health organizations achieve full census through integrated marketing, admissions, and technology-driven growth systems.
With more than a decade of experience working alongside Google, Microsoft, and high-growth technology companies, Gary has built and implemented scalable growth frameworks now used by 45+ treatment centers across the United States to drive admissions and operational efficiency.
As a speaker, Gary focuses on the intersection of patient acquisition, AI-driven search, and admissions performance, helping founders, operators, and investors identify the hidden bottlenecks limiting growth—and how to fix them.
The author of The Zero to 100 Million Sales Blueprint and The Goals, Grit & Greatness Planner™, Gary is driven by a mission to close the gap between the millions of people struggling with addiction and mental health and the care they need.